Recycled Glass Industry Procurement Intelligence, Key Factors And Emerging Opportunities till 20271/17/2022 Growing awareness about the environment and the need of reducing glass waste in driven the need for glass recycling. Glass is 100% recyclable and can be recycled endlessly without loss in quality or purity. Recycled glass can be substituted for up to 95% of raw materials. Recycled glass reduces carbon emissions, reduces the consumption of raw materials of glass manufacturing, extends the life of plant equipment, such as furnaces, and saves energy. Following is the process of industrial glass recycling:
Read report summary or request a free sample copy of the report “Recycled Glass Industry Procurement Intelligence, Supplier Intelligence, Supplier Ranking, Pricing & Cost Structure Intelligence, Best Practices, Engagement Model, Low & Best Cost Country, Day One Analysis Report, 2020 – 2027” Demand Outlook The global recycled glass market was valued at ~USD 4 billion in 2020 and it is expected to grow at a CAGR of 6% from 2020 to 2027 due to the rising demand for an effective and sustainable waste management system. Many governments are promoting the usage of recycled glass for environmental benefits such as, recycling one ton of glass saves 670 kg of C02. Europe is leading the global recycled glass market with more than 30% share. In Europe, 70% of glass bottles are collected for recycling. Countries like Belgium, Sweden, and Switzerland have over 90% recycling rates. In terms of product, the glass cullet segment is the largest segment. It accounted for more than 50% of the overall recycled glass market. More than 95% of glass cullet collected, turn into glasses. The container and fiberglass industries collectively purchase more than 3 million tons of recycled glass annually, which is used in the production of new containers and fiberglass products. Cost Drivers Determining the cost of glass recycling is very complicated because, in some countries, waste glass collection is sponsored by glass manufacturers. Whereas, in some cases, the collection is sponsored by local municipal authorities. Predominantly, a glass collecting company or agency does the initial sorting and cleaning of collected waste glass. This process is the major cost driver of glass recycling. It accounted for more than 20% of the glass recycling cost. After cleaning, collection agencies sell the glass to glass container manufacturers. When the glass cullet reaches glass container manufacturers, the cost of glass recycling is determined by the raw material costs. Major raw materials include sand, limestone, soda ash, and cullet. The cost of raw material during glass manufacturing from recycled cullet accounted for more than 50% of the overall cost of production. Find more research reports by Grand View Research:
Some of the key suppliers of recycled glass are:
Check out the featured Add-on Services offered with Recycled Glass Industry Procurement Intelligence Report. About us: A smart and effective supply chain is essential for growth in any organization. Pipeline division at Grand View Research provides detailed insights on every aspect of the supply chain which helps in efficient procurement decisions. Our services include (not limited to): Market Intelligence involving - market size and forecast, growth factors, and driving trends Price and Cost Intelligence - pricing models adopted for the category, the total cost of ownership Supplier Intelligence - rich insight on supplier landscape, and identifies suppliers who are dominating, emerging, lounging, and specializing Sourcing / Procurement Intelligence - best practices followed in the industry, identifying standard KPIs and SLAs, peer analysis, negotiation strategies to be utilized with the suppliers, and best-suited countries for sourcing to minimize supply chain disruption Our market/procurement Intelligence reports include in-depth and actionable insights that help clients in understanding the different aspects of the supply chain and take more effective decisions. Find More information @ https://www.grandviewresearch.com/pipeline Contact Information: Sherry James Corporate Sales Specialist, USA Grand View Research, Inc. Phone: 1-415-349-0058 Toll Free: 1-888-202-9519 Email: [email protected] Web: https://www.grandviewresearch.com Follow Us: LinkedIn | Twitter
0 Comments
Polyvinyl acetate (PVA) is a colorless, nontoxic, synthetic resin prepared by the polymerization of vinyl acetate. It has good resistance to UV and oxidation. PVA is extensively used in the packaging industry as adhesives. PVA emulsions are inexpensive and possess good adhesion to many porous substrates, but are not effective on non-porous surfaces. They are one of the main ingredients of water-based glues, commonly referred to as wood glue, carpenter's glue, Elmer's glue (USA), or white glue.
PVA is used as an inexpensive, low-toxic, and no odor adhesive to bond and seal high-energy surfaces such as paper, corrugated cartons, cotton, and wood, etc. It is often preferred over other types of adhesives due to its low cost, good stability to light, and yellowing resistance capability. PVA is also used as a plasticizer and thickener for paints, textile finishes, plastics, cement, and chewing gum. It is relatively (~50%) cheaper than other acrylic resins and is therefore often added to acrylic latex paints to reduce the production cost. However, the best exterior water-based paints are 100% acrylic due to elasticity and other factors and polyvinyl acetate is generally viewed as inappropriate for exterior uses due to its water sensitivity. Read report summary or request a free sample copy of the report “Polyvinyl acetate Industry Procurement Intelligence, Supplier Intelligence, Supplier Ranking, Pricing & Cost Structure Intelligence, Best Practices, Engagement Model, Low & Best Cost Country, Day One Analysis Report, 2021 – 2027” Demand Outlook The global polyvinyl acetate market was valued at ~USD 5 billion in 2020 and it is expected to grow at a CAGR of 5% from 2021 to 2027 due to increasing demand for adhesive from key industries such as construction, automotive, and furniture. The rising demand for paint and coatings from APAC and Latin American markets is also expected to fuel the growth of the global PVA industry. APAC is the largest geographic segment in the global PVA market with more than 45% market share followed by Europe and North America with 25% and 15% market share respectively. Increasing construction spending coupled with growing industrial development in emerging markets of China and India is anticipated to drive the regional market. APAC PVA market is also expected to witness the highest growth rate during the forecast period. Cost Drivers Raw materials and feedstocks are the key cost driver of polyvinyl acetate production. The raw materials are majorly categorized into two segments; solvents and initiators. Solvents include methanol, ethyl acetate, and benzene. Initiators include benzoyl peroxide, azobisisobutyronitrile (AIBN), and lauroyl peroxide. Both solvent and initiators account for more than 40% of the overall cost of production followed by machinery costs, equipment costs, labor costs, and maintenance costs. The price of raw materials are somewhat stable for the last few years. Hence, reducing costs from other components like machinery, equipment and labor would give PVA producers a better profit margin. Find more research reports by Grand View Research:
Some of the key suppliers of polyvinyl acetate are:
Check out the featured Add-on Services offered with Polyvinyl acetate Industry Procurement Intelligence Report. About us: A smart and effective supply chain is essential for growth in any organization. Pipeline division at Grand View Research provides detailed insights on every aspect of the supply chain which helps in efficient procurement decisions. Our services include (not limited to): Market Intelligence involving - market size and forecast, growth factors, and driving trends Price and Cost Intelligence - pricing models adopted for the category, the total cost of ownership Supplier Intelligence - rich insight on supplier landscape, and identifies suppliers who are dominating, emerging, lounging, and specializing Sourcing / Procurement Intelligence - best practices followed in the industry, identifying standard KPIs and SLAs, peer analysis, negotiation strategies to be utilized with the suppliers, and best-suited countries for sourcing to minimize supply chain disruption Our market/procurement Intelligence reports include in-depth and actionable insights that help clients in understanding the different aspects of the supply chain and take more effective decisions. Find More information @ https://www.grandviewresearch.com/pipeline Contact Information: Sherry James Corporate Sales Specialist, USA Grand View Research, Inc. Phone: 1-415-349-0058 Toll Free: 1-888-202-9519 Email: [email protected] Web: https://www.grandviewresearch.com Follow Us: LinkedIn | Twitter Phosphate is one of the most common elements mined primarily from phosphate rock. It is a chemical derivative of phosphoric acid and the majority of its global production is absorbed by fertilizer manufacturing industries in the booming agricultural sector. One metric ton of phosphate rock can produce more than 100 metric tons of phosphate granules. Phosphates can be segmented into the following categories:
Demand Outlook The global phosphate market was valued at USD 72 billion in 2020 and it is expected to grow at a CAGR of 2% from 2020 to 2027 majorly due to the rising demand for ammonium phosphate, from the manufacturing market. APAC is leading the global phosphate market with more than 40% share followed by Europe and North America. As agriculture is a core constituent of the economy in APAC countries like India China, these countries are responsible for generating high demand for phosphate and related products for the last five years. For instance, India is one of the leading countries, with more than 25% of world imports for natural calcium phosphates and natural aluminum calcium phosphates. In terms of applications, the phosphate fertilizer segment is expected to have the highest growth rate in APAC countries due to increase in agricultural spending and growing demand. Cost Drivers Phosphate rock is the most important feedstock of phosphate production. It is the major cost driver of overall production cost. The cost of phosphate rock accounted for more than 50% of the one-unit phosphate production. In the last two years, the price of phosphate rock fluctuate significantly majorly due to supply-demand disruption during Covid-19. The price of phosphate rock has witnessed a gradual decrease over the last ten years. However, it is expected to increase moderately during the forecast period. Find more research reports by Grand View Research:
Some of the key phosphate suppliers are:
About us: A smart and effective supply chain is essential for growth in any organization. Pipeline division at Grand View Research provides detailed insights on every aspect of the supply chain which helps in efficient procurement decisions. Our services include (not limited to): Market Intelligence involving - market size and forecast, growth factors, and driving trends Price and Cost Intelligence - pricing models adopted for the category, the total cost of ownership Supplier Intelligence - rich insight on supplier landscape, and identifies suppliers who are dominating, emerging, lounging, and specializing Sourcing / Procurement Intelligence - best practices followed in the industry, identifying standard KPIs and SLAs, peer analysis, negotiation strategies to be utilized with the suppliers, and best-suited countries for sourcing to minimize supply chain disruption Our market/procurement Intelligence reports include in-depth and actionable insights that help clients in understanding the different aspects of the supply chain and take more effective decisions. Find More information @ https://www.grandviewresearch.com/pipeline Contact Information: Sherry James Corporate Sales Specialist, USA Grand View Research, Inc. Phone: 1-415-349-0058 Toll Free: 1-888-202-9519 Email: [email protected] Web: https://www.grandviewresearch.com Follow Us: LinkedIn | Twitter A banking and financial services market include a group or network of institutions, responsible for operating a payment system, providing loans, taking deposits, and helping clients with investments. Banking and financial services can be categorized into ten major categories:
Demand Outlook The global banking and financial services market was valued at ~USD 20 trillion in 2020 and it is expected to grow at a CAGR of 6% from 2020 to 2027. The growth is majorly attributed due to the companies rearranging their operations and recovering from the COVID-19 pandemic, which had earlier led to restrictive containment measures including social distancing, remote working, and the closure of commercial activities. Banks and financial service providers are adopting digitization to modernize their commercial lending businesses owing to increasing competition among banks and growing demand for the simplified and quick commercial lending process. Cost Drivers The cost of banking and financial services can be categorized into two segments; facility cost and service cost. Facility costs include site management and maintenance cost, in-house machinery cost, etc. However, the major cost driver of the banking sector is the service cost. Service cost is segmented into employee costs, technology costs, training & development costs, employee benefits, taxes, and legal expenses. Among these, employee costs hold more than 60% share in the overall cost of banking and financial services followed by technology and employee training costs. Find more research reports by Grand View Research:
Some of the leading banking and financial service providers are:
About us: A smart and effective supply chain is essential for growth in any organization. Pipeline division at Grand View Research provides detailed insights on every aspect of the supply chain which helps in efficient procurement decisions. Our services include (not limited to): Market Intelligence involving - market size and forecast, growth factors, and driving trends Price and Cost Intelligence - pricing models adopted for the category, the total cost of ownership Supplier Intelligence - rich insight on supplier landscape, and identifies suppliers who are dominating, emerging, lounging, and specializing Sourcing / Procurement Intelligence - best practices followed in the industry, identifying standard KPIs and SLAs, peer analysis, negotiation strategies to be utilized with the suppliers, and best-suited countries for sourcing to minimize supply chain disruption Our market/procurement Intelligence reports include in-depth and actionable insights that help clients in understanding the different aspects of the supply chain and take more effective decisions. Find More information @ https://www.grandviewresearch.com/pipeline Contact Information: Sherry James Corporate Sales Specialist, USA Grand View Research, Inc. Phone: 1-415-349-0058 Toll Free: 1-888-202-9519 Email: [email protected] Web: https://www.grandviewresearch.com Follow Us: LinkedIn | Twitter An automotive sensor is a device that monitors the condition and keeps track of almost everything happening in and outside a vehicle, allowing the onboard computers to make decisions. These decisions help to improve engine performance, reduce emissions, improve safety, etc. Following are the most commonly used sensors across different vehicles:
Demand Outlook The global automotive sensor market was valued at ~USD 25-30 billion in 2020 and it is expected to grow at a CAGR of 7-10% from 2020 to 2027. The increasing adoption of hybrid electric vehicles has increased the demand for various automotive sensors such as current sensors, temperature sensors, cell voltage sensors, and other components for battery management systems. APAC is the largest geographic segment in the global automotive sensor market with more than 50% revenue share in 2020. The growth in APAC is driven by the growing adoption of electric vehicles in China, South Korea, and Japan. Favorable government policies regarding the use of electric vehicles have propelled market potential for automotive sensor makers in the region. For instance, in January 2021, South Korea approved an electric vehicle subsidy budget of USD891.7 million for 2021. EV cars with a price range of less than USD53,000 will be fully subsidized. Cost Drivers Raw material cost is the major cost driver of automotive sensor manufacturing. It accounted for more than one-third of the overall cost of production. Thermoplastics like PET (Polyethylene terephthalate), PBT (Polybutylene terephthalate), ceramics are widely used raw materials for automotive sensors. Other major costs include facility costs, machinery costs, labor costs, etc. Find more research reports by Grand View Research:
Check out the featured Add-on Services offered with Sugar Processing Market Procurement Intelligence Report. About us: A smart and effective supply chain is essential for growth in any organization. Pipeline division at Grand View Research provides detailed insights on every aspect of the supply chain which helps in efficient procurement decisions. Our services include (not limited to): Market Intelligence involving - market size and forecast, growth factors, and driving trends Price and Cost Intelligence - pricing models adopted for the category, the total cost of ownership Supplier Intelligence - rich insight on supplier landscape, and identifies suppliers who are dominating, emerging, lounging, and specializing Sourcing / Procurement Intelligence - best practices followed in the industry, identifying standard KPIs and SLAs, peer analysis, negotiation strategies to be utilized with the suppliers, and best-suited countries for sourcing to minimize supply chain disruption Our market/procurement Intelligence reports include in-depth and actionable insights that help clients in understanding the different aspects of the supply chain and take more effective decisions. Find More information @ https://www.grandviewresearch.com/pipeline Contact Information: Sherry James Corporate Sales Specialist, USA Grand View Research, Inc. Phone: 1-415-349-0058 Toll Free: 1-888-202-9519 Email: [email protected] Web: https://www.grandviewresearch.com Follow Us: LinkedIn | Twitter Advanced Driver Assistance Systems Industry Procurement Intelligence, Trends With Research Till 20271/12/2022 The majority of the automotive accidents occurring currently are due to human error or are ones whose impact could have been avoided with better and cautious driving. To reduce and prevent such instances, automotive companies are implementing Advanced Driver Assistance Systems in their vehicles. Advanced Driver Assistance Systems, commonly known as ADAS, provide five safety-essential features. These include pedestrian detection and avoidance, lane departure warning and correction, traffic sign recognition, automatic emergency braking, and blind-spot detection. ADAS is one of the primary features that lay down the foundations for an autonomous vehicle. ADAS works on three primary types of sensors. They are radar/LIDAR, cameras, and ultrasound. The objective of an ADAS is to provide a 360-degree detection capacity of the vehicle, including the blind spots to minimize risks while driving.
Read report summary or request a free sample copy of the report “Advanced Driver Assistance Systems Industry Procurement Intelligence, Supplier Intelligence, Supplier Ranking, Pricing & Cost Structure Intelligence, Best Practices, Engagement Model, Low & Best Cost Country, Day One Analysis Report, 2020 – 2027” Demand Outlook The global advanced driver assistance systems market was valued at USD 17.6 billion in 2020. The market is projected to grow at a CAGR of 12.3% from 2020 to 2027. Geographically, the European market is the largest market for advanced driver assistance systems as of 2020. Demand for semi-autonomous vehicles or the requirement of driving assistance features for the new versions of EV is generating additional demand for ADAS in the market. The COVID-19 pandemic has resulted in a decline in the advanced driver assistance systems industry globally. Several OEMs have paused or reduced manufacturing vehicles. This has directly affected the tier 1 suppliers and providers of advanced driver assistance systems globally. However, the automotive market is currently recuperating from the effects of the pandemic. While the market is yet to reach normalcy, industry experts expect that by Q2, 2022, the demand for automobiles, especially ones with semi-autonomous vehicle features and safety features like advanced driver assistance systems will increase. Cost Drivers The advanced driver assistance systems industry is still innovating and undergoing technical changes. With changing requirements from end-users, OEMs are laying down varying requirements which the suppliers of advanced driver assistance systems have to cater to. This makes it difficult for suppliers to have market-level cost drivers. However, manufacturing processes and procurement strategies help reduce the cost of manufacturing and the cost of operations. Also, depending upon the vehicle type, margins may be adjusted, leaving scope for better profit margins. But there are other market drivers like shifting preference to semi-autonomous vehicles and focus on vehicle safety in addition to government mandates which makes OEMs inculcate a certain safety standard in their vehicles to achieve the required NCAP rating for selling their vehicles in a certain geography. These factors are helping drive the market in terms of the adoption of advanced driver assistance systems. Find more research reports by Grand View Research:
Check out the featured Add-on Services offered with Advanced Driver Assistance Systems Industry Procurement Intelligence Report. About us: A smart and effective supply chain is essential for growth in any organization. Pipeline division at Grand View Research provides detailed insights on every aspect of the supply chain which helps in efficient procurement decisions. Our services include (not limited to): Market Intelligence involving - market size and forecast, growth factors, and driving trends Price and Cost Intelligence - pricing models adopted for the category, the total cost of ownership Supplier Intelligence - rich insight on supplier landscape, and identifies suppliers who are dominating, emerging, lounging, and specializing Sourcing / Procurement Intelligence - best practices followed in the industry, identifying standard KPIs and SLAs, peer analysis, negotiation strategies to be utilized with the suppliers, and best-suited countries for sourcing to minimize supply chain disruption Our market/procurement Intelligence reports include in-depth and actionable insights that help clients in understanding the different aspects of the supply chain and take more effective decisions. Find More information @ https://www.grandviewresearch.com/pipeline Contact Information: Sherry James Corporate Sales Specialist, USA Grand View Research, Inc. Phone: 1-415-349-0058 Toll Free: 1-888-202-9519 Email: [email protected] Web: https://www.grandviewresearch.com Follow Us: LinkedIn | Twitter 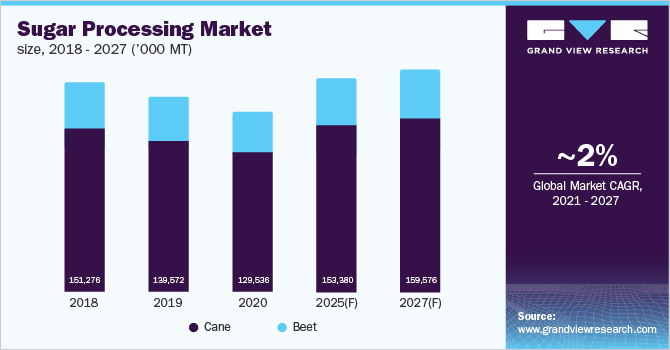 Brazil has been the leading sugarcane producer globally for the last two decades. However, since the beginning of 2019, sugarcane production in the country has decreased by approximately 5%. This can be attributed to the unfavorably dry weather and high incidence of fire outbreaks in the fields. In addition, steady grain prices have encouraged the shift of marginal sugarcane areas to soybeans and corn. This sugar production trend continued due to Covid-19 in 2020. All these issues with sugar production in Brazil help India to reduce the production gap with Brazil, capturing several markets that were previously dominated by Brazil. For instance, Indonesia used to import more than 90% of its sugar from Brazil. However, the country shifted its sourcing destination from Brazil to India due to the pandemic.
The Indian government has taken numerous initiatives to improve sugarcane production in the country. For instance, the government has announced an incentive for sugar mills in the form of an additional domestic sales quota to those that export sugar and divert the commodity toward ethanol making in the new 2021-22 season starting October. The government has also urged sugar mills to take advantage of firm global sugar prices and plan the export of raw sugar during this new season (October-September). Moreover, the Indian government is planning to invest approximately USD 5 billion over the next few years to increase ethanol production by 80%. Read report summary or request a free sample copy of the report “Sugar Processing Market Procurement Intelligence, Supplier Intelligence, Supplier Ranking, Pricing & Cost Structure Intelligence, Best Practices, Engagement Model, Low & Best Cost Country, Day One Analysis Report, 2021 – 2027” Sugar Processing Category Intelligence Highlights:
Grand View Research has identified the following key cost components for Sugar Processing:
“Feedstock is the major cost component of Sugar Processing, accounting for more than 45% of the total cost of sugar production." Browse our other Reports:
Operational Capabilities - Weightage for Supplier Ranking and Selection in Sugar Processing Category:
Functional Capabilities - Weightage for Supplier Ranking and Selection in Sugar Processing Category:
List of Key suppliers of Catering Services Category:
Check out the featured Addon Services offered with Sugar Processing Market Procurement Intelligence Report: About us: A smart and effective supply chain is essential for growth in any organization. Pipeline division at Grand View Research provides detailed insights on every aspect of the supply chain which helps in efficient procurement decisions. Our services include (not limited to): Market Intelligence involving - market size and forecast, growth factors, and driving trends Price and Cost Intelligence - pricing models adopted for the category, the total cost of ownership Supplier Intelligence - rich insight on supplier landscape, and identifies suppliers who are dominating, emerging, lounging, and specializing Sourcing / Procurement Intelligence - best practices followed in the industry, identifying standard KPIs and SLAs, peer analysis, negotiation strategies to be utilized with the suppliers, and best-suited countries for sourcing to minimize supply chain disruption Our market/procurement Intelligence reports include in-depth and actionable insights that help clients in understanding the different aspects of the supply chain and take more effective decisions. Find More information @ https://www.grandviewresearch.com/pipeline Contact Information: Sherry James Corporate Sales Specialist, USA Grand View Research, Inc. Phone: 1-415-349-0058 Toll Free: 1-888-202-9519 Email: [email protected] Web: https://www.grandviewresearch.com Follow Us: LinkedIn | Twitter |
Archives
September 2022
Categories |
 RSS Feed
